
Posted on 25 Jul 2025
World crude steel production for the 70 countries reporting to the World Steel Association (worldsteel) was 151.4 million tonnes (Mt) in June 2025, a 5.8% decrease compared to June 2024.
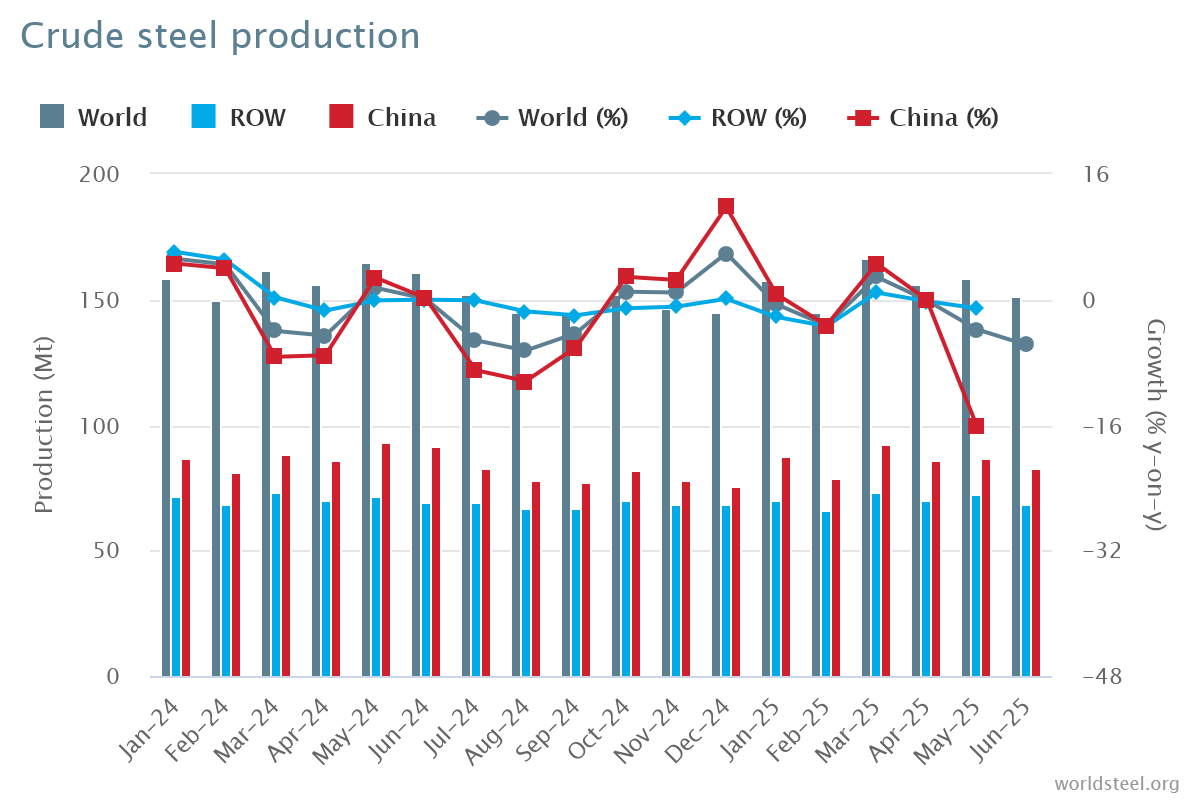
Crude steel production by region
Africa produced 1.7 Mt in June 2025, up 3.0% on June 2024. Asia and Oceania produced 112.9 Mt, down 6.2%. The EU (27) produced 10.4 Mt, down 8.2%. Europe, Other produced 3.3 Mt, down 8.4%. The Middle East produced 4.3 Mt, down 4.9%. North America produced 8.7 Mt, up 1.2%. Russia & other CIS + Ukraine produced 6.7 Mt, down 8.8%. South America produced 3.5 Mt, up 1.3%.
Table 1. Crude steel production by region
| Jun 2025 (Mt) | % change Jun 25/24 | Jan-Jun 2025 (Mt) | % change Jan-Jun 25/24 | |
| Africa | 1.7 | 3.0 | 11.4 | 4.1 |
| Asia and Oceania | 112.9 | -6.2 | 693.9 | -1.9 |
| EU (27) | 10.4 | -8.2 | 65.4 | -3.3 |
| Europe, Other | 3.3 | -8.4 | 20.8 | -7.1 |
| Middle East | 4.3 | -4.9 | 27.5 | -5.4 |
| North America | 8.7 | 1.2 | 53.2 | -0.6 |
| Russia & other CIS + Ukraine | 6.7 | -8.8 | 41.6 | -5.4 |
| South America | 3.5 | 1.3 | 20.5 | -0.4 |
| Total 70 countries | 151.4 | -5.8 | 934.3 | -2.2 |
The 70 countries included in this table accounted for approximately 98% of total world crude steel production in 2024.
Regions and countries covered by the table:
Top 10 steel-producing countries
China produced 83.2 Mt in June 2025, down 9.2% on June 2024. India produced 13.6 Mt, up 13.3%. Japan produced 6.7 Mt, down 4.4%. The United States produced 6.9 Mt, up 4.6%. Russia is estimated to have produced 5.6 Mt, down 7.4%. South Korea produced 5.0 Mt, down 1.8%. Türkiye produced 2.9 Mt, down 3.5%. Germany produced 2.7 Mt, down 15.9%. Brazil produced 2.8 Mt, down -0.5%. Iran is estimated to have produced 2.2 Mt, down 15.5%.
Table 2. Top 10 steel-producing countries
| Jun 2025 (Mt) | % change Jun 25/24 | Jan-Jun 2025 (Mt) | % change Jan-Jun 25/24 | ||
| China | 83.2 | -9.2 | 514.8 | -3.0 | |
| India | 13.6 | 13.3 | 80.9 | 9.2 | |
| Japan | 6.7 | -4.4 | 40.6 | -5.0 | |
| United States | 6.9 | 4.6 | 40.2 | 0.8 | |
| Russia | 5.6 | e | -7.4 | 34.8 | -5.6 |
| South Korea | 5.0 | -1.8 | 30.6 | -2.8 | |
| Türkiye | 2.9 | -3.5 | 18.3 | -1.7 | |
| Germany | 2.7 | -15.9 | 17.1 | -11.6 | |
| Brazil | 2.8 | -0.5 | 16.5 | 0.5 | |
| Iran | 2.2 | e | -15.5 | 15.6 | -10.3 |
e – estimated. The ranking of the top 10 producing countries is based on year-to-date aggregate
Source:World Steel Association