
Posted on 23 May 2025
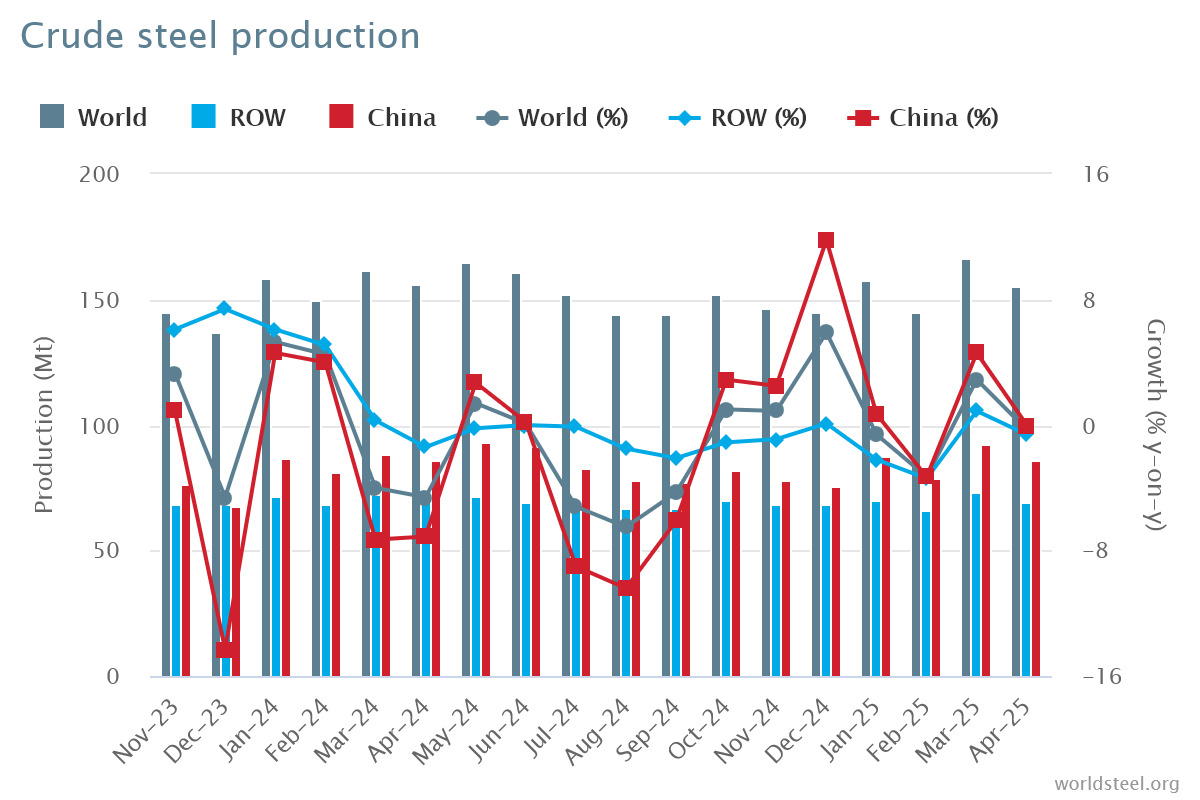
Crude steel production by region
Africa produced 1.9 Mt in April 2025, up 6.3% on April 2024. Asia and Oceania produced 115.0 Mt, up 0.1%. The EU (27) produced 11.1 Mt, down 2.6%. Europe, Other produced 3.4 Mt, down 0.5%. The Middle East produced 5.2 Mt, up 2.2%. North America produced 9.0 Mt, up 0.2%. Russia & other CIS + Ukraine produced 6.9 Mt, down 4.4%. South America produced 3.3 Mt, down 2.4%.
Table 1. Crude steel production by region
| Apr 2025 (Mt) | % change Apr 25/24 | Jan-Apr 2025 (Mt) | % change Jan-Apr 25/24 | |
| Africa | 1.9 | 6.3 | 7.7 | 4.0 |
| Asia and Oceania | 115.0 | 0.1 | 463.9 | 0.3 |
| EU (27) | 11.1 | -2.6 | 43.5 | -2.4 |
| Europe, Other | 3.4 | -0.5 | 13.9 | -6.2 |
| Middle East | 5.2 | 2.2 | 18.4 | -5.7 |
| North America | 9.0 | 0.2 | 35.9 | 0.3 |
| Russia & other CIS + Ukraine | 6.9 | -4.4 | 27.3 | -3.4 |
| South America | 3.3 | -2.4 | 13.7 | -1.5 |
| Total 69 countries | 155.7 | -0.3 | 624.4 | -0.4 |
The 69 countries included in this table accounted for approximately 98% of total world crude steel production in 2024.
Regions and countries covered by the table:
Top 10 steel-producing countries
China produced 86.0 Mt in April 2025, the same as in April 2024. India produced 12.9 Mt, up 5.6%. Japan produced 6.6 Mt, down 6.4%. The United States produced 6.6 Mt, down 0.3%. Russia is estimated to have produced 5.8 Mt, down 5.1%. South Korea produced 5.0 Mt, down 2.5%. Türkiye produced 3.0 Mt, up 7.0%. Germany produced 3.0 Mt, down 10.1%. Brazil produced 2.6 Mt, down 3.1%. Iran produced 3.3 Mt, up 4.6%.
Table 2. Top 10 steel-producing countries
| Apr 2025 (Mt) | % change Apr 25/24 | Jan-Apr 2025 (Mt) | % change Jan-Apr 25/24 | ||
| China | 86.0 | 0.0 | 345.4 | 0.4 | |
| India | 12.9 | 5.6 | 53.2 | 6.9 | |
| Japan | 6.6 | -6.4 | 27.0 | -5.3 | |
| United States | 6.6 | -0.3 | 26.4 | 0.0 | |
| Russia | 5.8 | e | -5.1 | 23.4 | -4.5 |
| South Korea | 5.0 | -2.5 | 20.5 | -3.4 | |
| Türkiye | 3.0 | 7.0 | 12.3 | -1.0 | |
| Germany | 3.0 | -10.1 | 11.4 | -11.9 | |
| Brazil | 2.6 | -3.1 | 11.0 | -0.3 | |
| Iran | 3.3 | 4.6 | 10.6 | -8.0 |
e – estimated. Ranking of top 10 producing countries is based on year-to-date aggregate
Source:World Steel Association