
Posted on 26 Jan 2026
Africa produced 1.9 Mt in December 2025, down 0.3% on December 2024. Asia and Oceania produced 99.7 Mt, down 6.3%. The EU (27) produced 9.9 Mt, up 3.9%. Europe, Other produced 3.8 Mt, up 13.8%. The Middle East produced 5.3 Mt, up 13.9%. North America produced 9.0 Mt, down 0.4%. Russia & other CIS + Ukraine produced 6.9 Mt, down 2.7%. South America produced 3.2 Mt, up 1.2%.
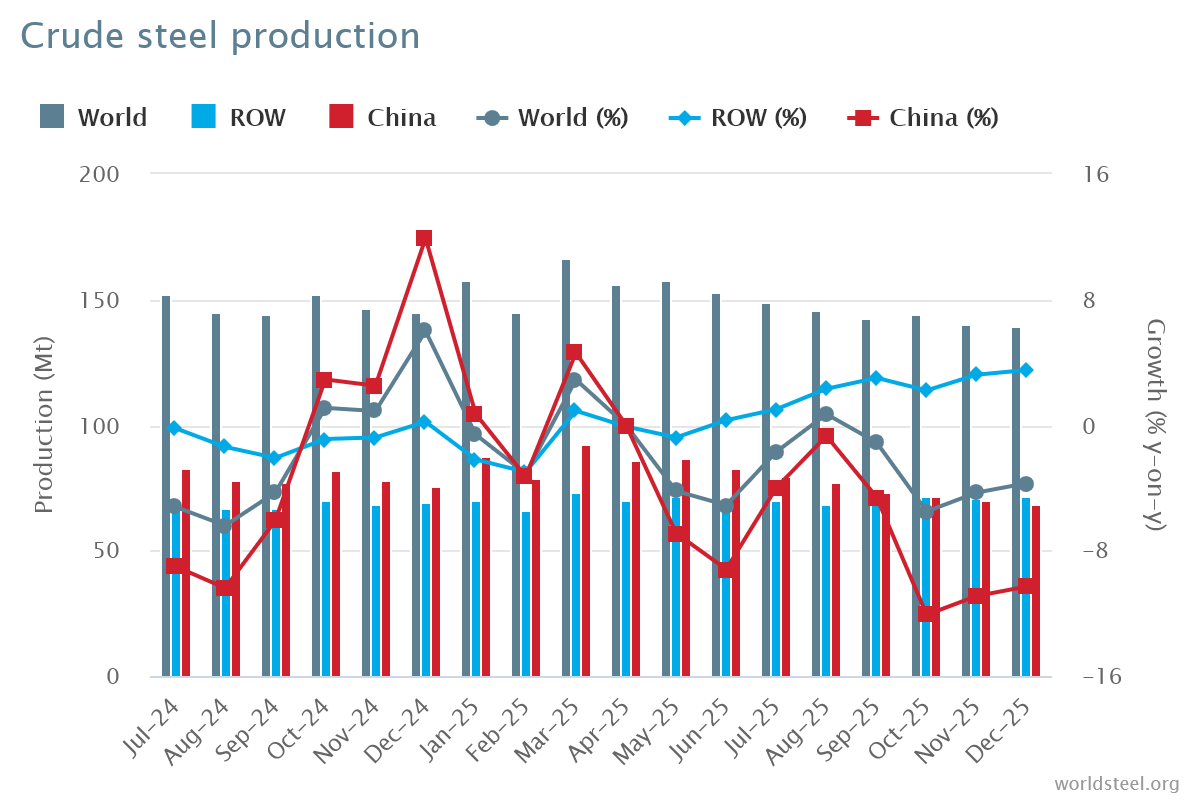
Table 1. Crude steel production by region
| Dec 2025 (Mt) | % change Dec 25/24 | Jan-Dec 2025 (Mt) | % change Jan-Dec 25/24 | |
| Africa | 1.9 | -0.3 | 23.2 | 3.8 |
| Asia and Oceania | 99.7 | -6.3 | 1,324.5 | -2.4 |
| EU (27) | 9.9 | 3.9 | 126.2 | -2.6 |
| Europe, Other | 3.8 | 13.8 | 42.8 | -0.9 |
| Middle East | 5.3 | 13.9 | 56.9 | 4.3 |
| North America | 9.0 | -0.4 | 107.4 | 0.7 |
| Russia & other CIS + Ukraine | 6.9 | -2.7 | 81.3 | -4.4 |
| South America | 3.2 | 1.2 | 41.5 | -1.2 |
| Total 70 countries | 139.6 | -3.7 | 1,803.8 | -2.0 |
The 70 countries included in this table accounted for approximately 98% of total world crude steel production in 2024.
Regions and countries covered by the table:
Top 10 steel-producing countries
China produced 68.2 Mt in December 2025, down 10.3% on December 2024. India produced 14.8 Mt, up 10.1%. The United States produced 6.9 Mt, up 3.6%. Japan produced 6.6 Mt, down 4.8%. Russia is estimated to have produced 5.8 Mt, down 4.4%. South Korea produced 5.2 Mt, down 2.4%. Türkiye produced 3.5 Mt, up 18.5%. Iran is estimated to have produced 3.0 Mt, up 16.2%. Germany produced 2.7 Mt, down 0.2%. Brazil produced 2.6 Mt, down 1.9%.
Table 2. Top 10 steel-producing countries
| Dec 2025 (Mt) | % change Dec 25/24 | Jan-Dec 2025 (Mt) | % change Jan-Dec 25/24 | |
| China | 68.2 | -10.3 | 960.8 | -4.4 |
| India | 14.8 | 10.1 | 164.9 | 10.4 |
| United States | 6.9 | 3.6 | 82.0 | 3.1 |
| Japan | 6.6 | -4.8 | 80.7 | -4.0 |
| Russia (e) | 5.8 | -4.4 | 67.8 | -4.5 |
| South Korea | 5.2 | -2.4 | 61.9 | -2.8 |
| Türkiye | 3.5 | 18.5 | 38.1 | 3.3 |
| Germany | 2.7 | -0.2 | 34.1 | -8.6 |
| Brazil | 2.6 | -1.9 | 33.3 | -1.6 |
| Iran (e) | 3.0 | 16.2 | 31.8 | 1.4 |
e – estimated. The ranking of the top 10 producing countries is based on year-to-date aggregate
Total world crude steel production was 1,849.4 Mt in 2025. Please see the Steel Data Viewer for the complete listing of annual production totals by country.
Table 3: 2025 global crude steel production
| Rank | Country | 2025 | 2024 | % change 2025/2024 |
|---|---|---|---|---|
| 1 | China | 960.8 | 1 005.1 | -4.4 |
| 2 | India | 164.9 | 149.4 | 10.4 |
| 3 | United States | 82.0 | 79.5 | 3.1 |
| 4 | Japan | 80.7 | 84.0 | -4.0 |
| 5 | Russia (e) | 67.8 | 71.0 | -4.5 |
| 6 | South Korea | 61.9 | 63.6 | -2.8 |
| 7 | Türkiye | 38.1 | 36.9 | 3.3 |
| 8 | Germany | 34.1 | 37.3 | -8.6 |
| 9 | Brazil | 33.3 | 33.9 | -1.6 |
| 10 | Iran (e) | 31.8 | 31.4 | 1.4 |
| 11 | Viet Nam | 24.7 | 22.0 | 12.2 |
| 12 | Italy | 20.7 | 20.0 | 3.6 |
| 13 | Indonesia (e) | 19.0 | 18.6 | 1.9 |
| 14 | Taiwan, China (e) | 17.1 | 19.2 | -10.8 |
| 15 | Mexico (e) | 13.5 | 14.3 | -5.9 |
| 16 | Spain (e) | 12.0 | 11.9 | 0.7 |
| 17 | Canada (e) | 11.5 | 12.3 | -7.2 |
| 18 | Saudi Arabia | 10.8 | 9.6 | 12.3 |
| 19 | Egypt | 10.6 | 10.7 | -0.8 |
| 20 | France (e) | 9.8 | 10.8 | -8.7 |
| 21 | Malaysia (e) | 9.0 | 9.0 | -0.2 |
| 22 | Austria | 7.6 | 7.1 | 5.9 |
| 23 | Ukraine | 7.4 | 7.6 | -2.2 |
| 24 | Poland (e) | 7.2 | 7.1 | 0.8 |
| 25 | Belgium (e) | 7.2 | 7.1 | 0.5 |
| 26 | Netherlands | 6.5 | 6.4 | 1.4 |
| 27 | Algeria (e) | 5.3 | 4.5 | 17.9 |
| 28 | Australia | 5.2 | 4.7 | 12.1 |
| 29 | Thailand (e) | 5.0 | 4.9 | 2.6 |
| 30 | Bangladesh (e) | 4.5 | 4.5 | 0.0 |
| 31 | South Africa | 4.5 | 4.7 | -4.7 |
| 32 | Kazakhstan | 4.3 | 4.2 | 2.2 |
| 33 | Argentina | 4.0 | 3.9 | 4.2 |
| 34 | Sweden | 4.0 | 4.0 | -0.7 |
| 35 | United Arab Emirates | 3.8 | 3.7 | 3.3 |
| 36 | Finland | 3.7 | 3.7 | 2.1 |
| 37 | Slovakia (e) | 3.7 | 3.9 | -5.6 |
| 38 | Pakistan (e) | 3.6 | 4.1 | -12.2 |
| 39 | Iraq (e) | 3.0 | 3.0 | 0.3 |
| 40 | Oman (e) | 3.0 | 3.0 | 0.0 |
| Others | 41.8 | 44.1 | -5.3 | |
| World | 1 849.4 | 1 886.8 | - 2.0 |
e – annual figure estimated using partial data or non-worldsteel resources.
* The world total production figure in this table includes estimates of other countries that only report annually.
#Ends#
Notes to Editors:
Source:World Steel Association